1992 Democratic Party presidential primaries
| ||||||||||||||||||||||||||||||||||||||||||||||||||||||
4,289 delegates[a] to the Democratic National Convention 2,145 (majority) votes needed to win | ||||||||||||||||||||||||||||||||||||||||||||||||||||||
|---|---|---|---|---|---|---|---|---|---|---|---|---|---|---|---|---|---|---|---|---|---|---|---|---|---|---|---|---|---|---|---|---|---|---|---|---|---|---|---|---|---|---|---|---|---|---|---|---|---|---|---|---|---|---|
| ||||||||||||||||||||||||||||||||||||||||||||||||||||||


Bill Clinton Jerry Brown Paul Tsongas Tom Harkin Bob Kerrey | ||||||||||||||||||||||||||||||||||||||||||||||||||||||
| ||||||||||||||||||||||||||||||||||||||||||||||||||||||

.jpg)
From February 10 to June 9, 1992, voters of the Democratic Party chose its nominee for president in the 1992 United States presidential election. Despite scandals and questions about his character, Arkansas Governor Bill Clinton won the nomination through a series of primary elections and caucuses culminating in the 1992 Democratic National Convention held from July 13 to July 16, 1992, in New York City. Clinton and Tennessee Senator Al Gore were nominated by the convention for president and vice president, respectively.
Clinton and Gore went on to take advantage of the chaos and disarray of the Reagan coalition and win the presidential election, defeating incumbent President George H. W. Bush and becoming the first Democratic nominee since Jimmy Carter to win a presidential election.
Background
Although the McGovern–Fraser Commission had recommended proportionality as early as 1972, this primary was the first to adopt the proportional 15% rule, still in place today, as the standard throughout the country. Any candidate receiving greater than 15% of the vote in a given congressional district (or in the case of New Jersey, state legislative district) would receive a proportional share of the apportioned delegates for that district or state.[1] For 1992 two-thirds of the delegates were selected in 35 primaries.[2]
Candidates
During the aftermath of the Gulf War, President George H. W. Bush's approval ratings were high. At one point after the successful performance by U.S. forces in Kuwait, President Bush had an 89% approval rating.[3]
As a result of Bush's high popularity, major high-profile Democratic candidates feared a high likelihood of defeat in the 1992 general election. This fear was "captured perfectly by Saturday Night Live in a skit called 'Campaign '92: The Race to Avoid Being the Guy Who Loses to Bush,'" in which each prospective major candidate "tried to top the other in explaining why they were unfit to run" for the presidency.[4][5][6]
Mario Cuomo and Jesse Jackson declined to seek the Democratic nomination for president, as did U.S. Senator and eventual Vice President Al Gore, whose son had been struck by a car and was undergoing extensive surgery and physical therapy.[7] However, Governors Bill Clinton and Jerry Brown and U.S. Senator Paul Tsongas opted to run for president.
Nominee
| Candidate | Most recent office | Home state | Campaign | Popular vote | Contests won | Running mate | |||
|---|---|---|---|---|---|---|---|---|---|
| Bill Clinton | _(1).jpg)
|
Governor of Arkansas (1979–1981) (1983–1992) |
(Campaign • Positions) Secured nomination: June 2, 1992 |
10,482,411 (52.01%) |
37 NY, NJ, PA, OH, WV, VA, NC, SC, GA, FL, MI, WI, IL, IN, KY, TN, AL, MS, LA, AR, NE, KS, OK, TX, NM, WY, MT, OR, CA, HI, DC, PR |
Al Gore | .jpg)
| ||
Eliminated at convention
| Candidate | Most recent office | Home state | Campaign
Withdrawal date |
Popular vote | Contests won | ||
|---|---|---|---|---|---|---|---|
| Jerry Brown | 
|
Governor of California (1975–1983) |
 (Campaign) Eliminated at Convention: |
4,071,232 (20.20%) |
6 AK, CO, CT, ME, NV, VT | ||
Withdrew during or before primaries
| Candidate | Most recent office | Home state | Campaign
Withdrawal date |
Popular vote | Contests won | ||
|---|---|---|---|---|---|---|---|
| Paul Tsongas | .jpg)
|
U.S. Senator from Massachusetts (1979–1985) |
Suspended Campaign: March 19, 1992 Endorsed Bill Clinton: June 3, 1992 |
3,656,010 (18.14%) |
9 AZ, DA, DE, MD, MA, NH, RI, UT, WA | ||
| Tom Harkin | 
|
U.S. Senator from Iowa (1985–2015) |
(Campaign) Withdrew: March 9, 1992 Endorsed Bill Clinton: March 26, 1992 |
280,304 (1.39%) |
3 ID caucus, IA, MN caucus | ||
| Bob Kerrey | 
|
U.S. Senator from Nebraska (1989–2001) |
Withdrew: March 5, 1992 Endorsed Bill Clinton: May 14, 1992 |
318,457 (1.58%) |
1 SD | ||
| Douglas Wilder | 
|
Governor of Virginia (1990–1994) |
 Withdrew: January 8, 1992 Endorsed Bill Clinton: July 14, 1992 |
240 (0.00%) |
0 | ||
Minor candidates
Other notable individuals campaigning for the nomination but not featuring in major polls were:
| Larry Agran | Lyndon LaRouche | Tom Laughlin | Eugene McCarthy |
|---|---|---|---|
 |
.jpg) |
 |
 |
| Mayor of Irvine, California (1982–1984), (1986-1990) |
No Elected Office (Head of the National Caucus of Labor Committees) |
No Elected Office (Actor) |
U.S. Senator from Minnesota (1959–1971) |
Declined
Note on Declination Dates:[b]

.jpg)
.jpg)
.jpg)


.jpg)
.jpg)
.jpg)
.jpg)

.jpg)

Speculated Candidates
The following potential candidates were considered possible candidates to run for the Democratic nomination in 1992 by the media, but never stated a preference for or against running.
- Senator Joe Biden of Delaware[25]
- Senator Bob Graham of Florida[25]
- Senator John Kerry of Massachusetts[25]
- Senator Chuck Robb of Virginia[25]
- Governor Ann Richards of Texas[26]
- General Norman Schwarzkopf Jr. of Florida[27]
- Senator Paul Simon of Illinois[26]
- Senator Tim Wirth of Colorado[25]
Timeline
Bush's high approval rating after the Gulf War made many Democrats feel that they could not defeat him in the election. Dick Gephardt, Al Gore, Jesse Jackson, Sam Nunn, and Jay Rockefeller did not enter the race despite speculation around them as candidates.[28]
Clinton, a Southerner with experience governing a more conservative state, positioned himself as a centrist New Democrat. He prepared for a run in 1992 amidst a crowded field seeking to beat the incumbent President George H. W. Bush. In the aftermath of the Persian Gulf War, Bush seemed unbeatable, but an economic recession—which ultimately proved to be small by historical standards—spurred the Democrats on. Tom Harkin won his native Iowa without much surprise. Clinton, meanwhile, was still a relatively unknown national candidate before the primary season when a woman named Gennifer Flowers appeared in the press to reveal allegations of an affair.[29] Clinton sought damage control by appearing on 60 Minutes with his wife, Hillary Clinton, for an interview with Steve Kroft. Paul Tsongas of Massachusetts won the primary in neighboring New Hampshire but Clinton's second-place finish – strengthened by Clinton's speech labeling himself "The Comeback Kid" – re-energized his campaign. Clinton swept nearly all of the Southern Super Tuesday primaries, making him the solid front runner. Jerry Brown, however, began to run a surprising insurgent campaign, particularly through use of a 1-800 number to receive grassroots funding. Brown "seemed to be the most left-wing and right-wing man in the field. called for term limits, a flat tax, and the abolition of the Department of Education."[30] Brown scored surprising wins in Connecticut and Colorado.
On March 17, Tsongas left the race when he decisively lost both the Illinois and Michigan primaries to Clinton, with Brown as a distant third. Exactly one week later, Brown eked out a narrow win in the bitterly fought Connecticut primary. As the press focused on the primaries in New York and Wisconsin, which were both to be held on the same day, Brown, who had taken the lead in polls in both states, made a serious gaffe: he announced to an audience of various leaders of New York City's Jewish community that, if nominated, he would consider the Reverend Jesse Jackson as a vice presidential candidate. Jackson was still a controversial figure in that community and Brown's polling numbers suffered. On April 7, he lost narrowly to Clinton in Wisconsin (37–34), and dramatically in New York (41–26). In addition, his "willingness to break with liberal orthodoxy on taxes led to denunciations from the party regulars, but by the end of the race he had been embraced by much of the Left."[30]
Although Brown continued to campaign in a number of states, he won no further primaries. Despite this, he still had a sizable number of delegates, and a big win in his home state of California would have deprived Clinton of sufficient support to win the nomination. After nearly a month of intense campaigning and multiple debates between the two candidates, Clinton managed to defeat Brown in the California primary by a margin of 47% to 40%. Clinton became the second candidate after George McGovern in 1972 to win the nomination without winning Iowa or New Hampshire. The same feat would be repeated nearly 30 years later by Joe Biden in 2020.
Clinton won 28 of the 35 states that held primaries while only winning 4 of the 16 states that used caucuses.[31] 70% of black voters supported Clinton, 15% supported Brown, and 8% supported Tsongas.[32]
Schedule and results
Tablemaker's Note:[c]
| Date
(daily totals) |
Contest and total popular vote |
Awarded pledged delegates |
Delegates won and popular vote | ||||||
|---|---|---|---|---|---|---|---|---|---|
| Bill Clinton |
Jerry Brown |
Paul Tsongas |
Tom Harkin |
Bob Kerrey |
Others | Uncommitted | |||
| February 10 | Iowa Caucuses 2,996 CDs |
0 of (49) | 76 CDs (2.81%) | 51 CDs (1.60%) | 128 CDs (4.11%) | 2,314 CDs (76.55%) | 72 CDs (2.41%) | - | 355 CDs (11.85%) |
| February 18 | New Hampshire Primary 167,664 |
18 of (18) | 9 Del. 41,540 (24.78%) |
13,659 (8.15%) |
9 Del. 55,663 (33.20%) |
17,063 (10.18%) |
18,584 (11.08%) |
21,155 (12.62%) |
- |
| February 22 | Maine Caucuses[33][34] 3,368 SDs |
0 of (24) | 501 SDs (14.88%) | 1,026 SDs (30.46%) | 970 SDs (28.80%) | 174 SDs (5.17%)[d] | 105 SDs (3.12%)[d] | - | 548 SDs (16.27%) |
| February 25 | South Dakota Primary[35] 59,794 |
15 of (15) | 3 Del. 11,421 (19.10%) |
2,304 (3.86%) |
5,756 (9.62%) |
5 Del. 15,153 (25.23%) |
7 Del. 23,974 (40.12%) |
1,238 (2.07%) |
- |
| March 3 (380) |
Colorado Primary[36] 239,643 |
47 of (47) | 14 Del. 64,470 (26.90%) |
18 Del. 69,073 (28.82%) |
15 Del. 61,360 (25.61%) |
5,866 (2.45%) |
29,572 (12.34%) |
3,946 (1.65%) |
5,356 (2.24%) |
| Georgia Primary[36][37] 454,631 |
76 of (76) | 54 Del. 259,907 (57.17%) |
36,808 (8.10%) |
22 Del. 109,148 (24.01%) |
9,479 (2.09%) |
22,033 (4.85%) |
- | 17,256 (3.80%) | |
| Idaho Caucuses[38] 372 SDs |
0 of (18) | 43 SDs (11.56%) | 17 SDs (4.57%) | 107 SDs (28.76%) | 110 SDs (29.57%) | 30 SDs (8.06%) | - | 65 SDs (17.47%) | |
| Maryland Primary[39] 531,068 |
67 of (67) | 29 Del. 189,905 (35.76%) |
46,480 (8.75%) |
38 Del. 230,490 (43.40%) |
32,899 (6.20%) |
27,035 (5.09%) |
4,259 (0.80) |
- | |
| Minnesota Caucuses[40] |
0 of (92) | (10.3%) | (8.2%) | (19.2%) | (26.7%) | (7.6%) | - | (24.3%) | |
| Utah Caucuses[41] 31,429 |
23 of (23) | 5 Del. 5,763 (18.34%) |
9 Del. 8,972 (28.55%) |
9 Del. 10,761 (34.24%) |
1,267 (4.03%) |
3,442 (10.95%) |
598 (1.90%) |
726 (2.31%) | |
| Washington Caucuses[42] ? CDs[e] |
0 of (72) | 835 CDs (15.9%) | 1,019 CDs (19.1%) | 1,485 CDs (27.9%) | 397 CDs (7.5%) | 221 CDs (4.1%) | - | 1,293 SDs (24.3%) | |
| American Samoa Caucuses[43] 31,429 |
3 of (3) | (9%) | - | - | - | - | (4%) | 3 Del. (87%) | |
| March 7 | Arizona Caucuses[44] 36,727 |
41 of (41) | 15 Del. 10,607 (29.28%) |
12 Del. 10,145 (27.62%) |
14 Del. 12,663 (34.48%) |
2,831 (7.71%) |
- | - | 334 (0.91%) |
| South Carolina Primary[45] 116,414 |
43 of (43) | 36 Del. 73,221 (62.90%) |
6,961 (5.98%) |
7 Del. 21,338 (18.33%) |
7,657 (6.58%) |
566 (0.49%) |
- | - | |
| Wyoming Caucuses[46][47] 274 SDs |
0 of (11) | 78 SDs (28.57%) | 63 SDs (23.08%) | 32 SDs (11.72%) | 39 SDs (14.29%) | – | 1 SD (0.36%) | 61 SDs (22.26%) | |
| March 8 | Nevada Caucuses[48] 1,546 CDs[f] |
0 of (17) | 400 CDs (25.87%) | 542 CDs (35.06%) | 305 CDs (19.73%) | 16 CDs (1.03%) | 6 CDs (0.39%) | 6 CDs (0.39%) | 266 CDs (17.21%) |
| March 10 (Super Tuesday) (777) |
Delaware Caucuses[49][50] 318 SDs 2,503 |
0 of (14) | 66 SDs (20.75%) 520 (20.78%) |
62 SDs (17.47%) 488 (19.50%) |
96 SDs (30.19%) 755 (30.16%) |
– | – | - | 94 SDs (29.56%) 740 (29.56%) |
| Florida Primary[51] 1,092,448 |
148 of (148) | 87 Del. 554,861 (50.79%) |
3 Del. 133,156 (12.19%) |
58 Del. 379,572 (34.75%) |
13,302 (1.22%) |
11,557 (1.06%) |
- | - | |
| Hawaii Caucuses[52] 2,966 |
0 of (20) | 1,501 (50.61%) | 409 (13.79%) | 421 (14.19%) | 406 (13.69%) | 13 (0.44%) | - | 216 (7.28%) | |
| Louisiana Primary[53] 384,426 |
60 of (60) | 59 Del. 267,029 (69.46%) |
25,480 (6.63%) |
1 Del. 42,509 (11.06%) |
4,033 (1.05%) |
2,984 (0.78%) |
42,391 (11.03%) |
- | |
| Massachusetts Primary[54] 794,115 |
94 of (94) | 86,817 (10.95%) |
6 Del. 115,746 (14.60%) |
88 Del. 526,297 (66.38%) |
3,764 (0.48%) |
5,409 (0.68%) |
12,218 (1.54%) |
43,864 (5.52%) | |
| Mississippi Primary[55] 191,200 |
39 of (39) | 39 Del. 139,893 (73.11%) |
18,396 (9.61%) |
15,538 (8.12%) |
2,509 (1.31%) |
1,660 (0.87%) |
1,394 (0.73%) |
11,807 (6.18%) | |
| Missouri Caucuses[56] 963 DDs[g] 22,500 |
0 of (92) | 434 DDs (45.07%) 10,148 (45.10%) |
55 DDs (5.71%) 1,282 (5.70%) |
98 DDs (10.18%) 2,295 (10.20%) |
– | – | - | 376 DDs (39.04%) 8,775 (39.00%) | |
| Oklahoma Primary[57] 416,129 |
45 of (45) | 38 Del. 293,266 (70.47%) |
7 Del. 69,624 (16.69%) |
– | 14,015 (3.40%) |
13,252 (3.20%) |
25,972 (3.20%) |
- | |
| Rhode Island Primary[58] 50,402 |
22 of (22) | 6 Del. 10,762 (21.22%) |
3 Del. 9,541 (18.82%) |
13 Del. 26,825 (52.90%) |
319 (0.63%) |
469 (0.92%) |
1,783 (3.54%) |
703 (1.39%) | |
| Tennessee Primary[59] 318,482 |
68 of (68) | 56 Del. 214,485 (67.35%) |
25,560 (8.02%) |
12 Del. 61,717 (19.38%) |
2,099 (0.66%) |
1,638 (0.51%) |
432 (0.14%) |
12,551 (3.94%) | |
| Texas Primary[60] 1,483,047 |
196 of (196) | 94 Del. 972,235 (65.56%) |
2 Del. 118,869 (8.02%) |
31 Del. 285,224 (19.23%) |
19,618 (1.32%) |
20,298 (1.37%) |
66,803 (4.50%) |
- | |
| March 17
(295) |
Illinois Primary[61] 1,504,130 |
164 of (164) | 107 Del. 776,829 (51.65%) |
11 Del. 220,346 (14.65%) |
46 Del. 387,891 (25.79%) |
30,710 (2.04%) |
10,916 (0.73%) |
9,826 (0.65%) |
67,612 (4.50%) |
| Michigan Primary[62] 585,972 |
131 of (131) | 74 Del. 297,280 (50.73%) |
37 Del. 151,400 (25.84%) |
20 Del. 97,017 (16.56%) |
6,265 (1.07%) |
3,219 (0.55%) |
2,955 (0.50%) |
27,836 (4.75%) | |
| March 19 | Democrats Abroad Caucuses[63] |
? | ? (27.00%) |
– | ? (37.00%) |
(7.00%) |
– | - | - |
| North Dakota Caucuses[64] 974 |
0 of (14) | 448 (46.00%) | 73 (7.49%) | 100 (10.27%) | 66 (6.78%) | 12 (1.23%) | 23 (2.36%) | 252 (25.87%) | |
| March 24 | Connecticut Primary[65] 173,119 |
53 of (53) | 22 Del. 61,698 (35.64%) |
21 Del. 64,472 (37.24%) |
10 Del. 33,811 (19.53%) |
1,919 (1.11%) |
1,169 (0.68%) |
4,620 (2.67%) |
5,430 (3.14%) |
| March 28 | Iowa County Conventions[66] 2,998 CDs |
0 of (49) | 347 CDs (11.57%) | 280 CDs (9.34%) | - | 1,105 CDs (36.86%) | - | 32 CDs (1.08%) | 1,234 CDs (41.16%) |
| Virgin Islands Caucuses[67] 31,429 |
3 of (3) | 1 Del. (42%) |
- | - | - | - | (4%) | 2 Del. (58%) | |
| March 31 | Vermont Caucus[68] 1,209 SDs[h] |
0 of (15) | 208 SDs (17.20%) | 573 SDs (47.40%) | 117 SDs (9.68%) | – | – | - | 311 SDs (25.72%) |
| April 2 | Alaska Caucus[69] 2,907 DDs[i] |
0 of (13) | 884 DDs (30.41%) | 964 DDs (33.16%) | - | – | – | - | 1,059 DDs (36.43%) |
| April 5 | North Dakota State Convention[70] |
14 of (14) | 3 Del. | - | - | - | - | - | 9 Del. |
| Puerto Rico Primary[71] 64,962 |
51 of (51) | 51 Del. 62,273 (95.86%) |
921 (1.42%) |
59 (0.09%) |
31 (0.05%) |
930 (1.43%) |
504 (0.78%) |
244 (0.38%) | |
| April 7 | Kansas Primary[72] 160,251 |
36 of (36) | 27 Del. 82,145 (51.26%) |
2 Del. 20,811 (12.99%) |
6 Del. 24,413 (15.23%) |
940 (0.59%) |
2,215 (1.38%) |
2,215 (1.38%) |
1 Del. 22,159 (13.83%) |
| Minnesota Primary[73] 204,402 |
0 of (92) | 63,584 (31.14%) | 62,474 (30.60%) | 43,588 (21.35%) | 4,077 (2.00%) | 1,191 (0.58%) | 17,890 (8.75%) | 11,366 (5.56%) | |
| New York Primary[74] 1,007,726 |
244 of (244) | 102 Del. 412,349 (40.92%) |
67 Del. 264,278 (26.23%) |
75 Del. 288,330 (28.61%) |
11,535 (1.15%) |
11,147 (1.11%) |
20,087 (1.99%) |
- | |
| Wisconsin Primary[75][76] 772,597 |
82 of (82) | 34 Del. 287,356 (37.19%) |
29 Del. 266,207 (34.46%) |
19 Del. 168,619 (21.83%) |
5,395 (0.70%) |
3,044 (0.39%) |
3,044 (3.43%) |
26,489 (2.00%) | |
| April 11 | Nevada County Conventions[77] 271 SDs[j] |
0 of (17) | 87 SDs (32.10%) | 114 SDs (42.07%) | 40 SDs (30.19%) | – | – | - | 30 SDs (29.56%) |
| Virginia Caucuses[78] |
0 of (78) | (52.00%) | (12.00%) | – | – | – | – | (36.00%) | |
| April 14 | Missouri District Conventions[k][79] |
50 of (92) | 24 Del. | 2 Del. | 3 Del. | - | - | - | 21 Del. |
| April 25 | Delaware State Convention[80] |
15 of (15) | 3 Del. | 3 Del. | 4 Del. | - | - | - | 5 Del. |
| Missouri District Conventions[l][81] |
25 of (92) | 10 Del. | - | - | - | - | - | 15 Del. | |
| Washington County Conventions[82][83] 2,003 DDs |
0 of (72) | 533 DDs (26.61%) | 476 DDs (23.76%) | 432 DDs (21.57%) | - | - | 1 DDs (0.05%) | 561 DDs (28.01%) | |
| April 28 | Pennsylvania Primary[84] 1,265,495[m] |
169 of (169) | 112 Del. 715,031 (56.48%) |
50 Del. 325,543 (25.72%) |
7 Del. 161,572 (12.76%) |
21,013 (1.66%) |
20,802 (1.64%) |
21,534 (1.70%) |
- |
| May 2 | Iowa District Conventions[85] |
32 of (49) | 4 Del. | 1 Del. | - | 17 Del. | - | - | 10 Del. |
| Missouri State Convention[86] |
17 of (92) | 9 Del. | 1 Del. | 2 Del. | - | - | - | 5 Del. | |
| Nevada State Convention[87] |
17 of (17) | 8 Del. | 6 Del. | - | - | - | - | 3 Del. | |
| Wyoming State Convention[88] |
11 of (11) | 5 Del. | 3 Del. | - | - | - | - | 3 Del. | |
| May 3 | Guam Caucuses[89] 1,020 |
3 of (3) | 1 Del. 500 (49%) |
204 (20%) |
- | - | - | - | 2 Del. 316 (31%) |
| May 5 | Indiana Primary[90] 476,849 |
77 of (77) | 57 Del. 301,905 (63.31%) |
20 Del. 102,379 (21.47%) |
58,215 (12.21%) |
– | 14,350 (3.01%) |
– | – |
| North Carolina Primary[91] 691,866 |
84 of (84) | 72 Del. 443,498 (54.10%) |
71,984 (10.40%) |
57,589 (8.32%) |
5,891 (0.85%) |
6,216 (0.90%) |
- | 12 Del. 106,697 (15.42%) | |
| Washington D.C. Primary[92] 61,842 |
17 of (17) | 17 Del. 45,685 (73.87%) |
57,589 (7.21%) |
71,984 (10.41%) |
– | – | – | 5,262 (8.51%) | |
| May 9 | Minnesota District Conventions[n][93] |
63 of (92) | 10 Del. | 4 Del. | - | - | - | - | 49 Del. |
| May 12 | Nebraska Primary[94] 150,587 |
25 of (25) | 13 Del. 68,562 (45.53%) |
8 Del. 31,673 (21.03%) |
10,707 (7.11%) |
4,239 (2.82%) |
– | 10,692 (7.10%) |
4 Del. 24,714 (16.41%) |
| West Virginia Primary[95] 317,587 |
31 of (31) | 31 Del. 227,815 (74.24%) |
36,505 (11.90%) |
21,271 (6.93%) |
2,774 (0.90%) |
3,152 (1.03%) |
15,349 (4.83%) |
10,721 (3.38%) | |
| May 16 | Vermont State Convention[96] |
15 of (15) | 3 Del. | 6 Del. | - | - | - | - | 6 Del. |
| May 17 | Maine State Convention[97] |
24 of (24) | 6 Del. | 10 Del. | 5 Del. | - | - | - | 3 Del. |
| May 19 | Oregon Primary[98] 354,332 |
47 of (47) | 29 Del. 159,802 (45.10%) |
18 Del. 110,494 (31.18%) |
37,139 (10.48%) |
– | – | 46,897 (13.24%) |
– |
| Washington Primary[99] 147,981 |
0 of (72) | 62,171 (42.01%) | 34,111 (23.05%) | 18,981 (12.83%) | 1,858 (1.26%) | 1,489 (1.01%) | 29,371 (19.85%) | - | |
| May 26 | Arkansas Primary[100] 506,679 |
36 of (36) | 30 Del. 344,758 (68.04%) |
55,800 (11.01%) |
– | – | – | 14,719 (2.90%) |
6 Del. 91,402 (18.04%) |
| Idaho Primary Primary[101] 55,124 |
0 of (18) | 27,004 (48.99%) | 9,212 (16.71%) | – | – | – | 2,879 (5.22%) | 16,029 (29.08%) | |
| Kentucky Primary Primary[102] 370,578 |
52 of (52) | 34 Del. 207,804 (56.08%) |
30,709 (8.29%) | 18,097 (4.88%) | 7,136 (1.93%) | 3,242 (0.87%) | - | 18 Del. 103,590 (27.95%) | |
| May 30 | Washington District Conventions[103] |
46 of (72) | 15 Del. | 10 Del. | 9 Del. | - | - | - | 12 Del. |
| May 31 | Alaska State Convention[104] |
14 of (14) | 5 Del. | - | - | - | - | - | 8 Del. |
| Hawaii State Convention[105][o] |
20 of (20) | 16 Del. | 2 Del. | - | 2 Del. | - | - | - | |
| June 2 | Alabama Primary[106] 450,899 |
55 of (55) | 43 Del. 307,621 (68.22%) |
30,626 (6.79%) |
– | – | – | 18,097 (4.83%) |
12 Del. 90,863 (20.15%) |
| California Primary[107] 2,863,419 |
348 of (348) | 191 Del. 1,359,112 (47.47%) |
157 Del. 1,150,460 (40.18%) |
212,522 (7.42%) |
– | 33,935 (1.19%) |
107,390 (3.75%) |
– | |
| Montana Primary[108] 117,471 |
16 of (16) | 8 Del. 54,989 (46.81%) |
3 Del. 21,704 (18.48%) |
12,614 (10.74%) |
– | – | – | 5 Del. 28,164 (23.98%) | |
| New Jersey Primary[109] 405,222 |
105 of (105) | 73 Del. 256,337 (63.26%) |
26 Del. 79,877 (19.71%) |
45,191 (11.15%) |
– | – | 2 Del. 23,817 (5.88%) |
– | |
| New Mexico Primary[110] 181,443 |
25 of (25) | 17 Del. 95,933 (52.87%) |
3 Del. 30,705 (16.92%) |
11,315 (6.24%) |
3,233 (1.78%) |
– | 4,988 (2.75%) |
5 Del. 35,269 (19.44%) | |
| Ohio Primary[111] 1,042,235 |
151 of (151) | 113 Del. 638,347 (61.25%) |
34 Del. 197,449 (18.94%) |
1 Del. 110,673 (10.62%) |
25,395 (2.44%) |
22,976 (2.20%) |
3 Del.[p] 47,395 (4.55%) |
- | |
| June 6 | Minnesota State Convention[112] |
29 of (92) | 7 Del. | 3 Del. | - | - | - | 1 Del.[q] | 18 Del. |
| Virginia State Convention[r][113] |
78 of (78) | 58 Del. | 3 Del. | - | - | - | - | 17 Del. | |
| June 7 | Washington State Convention[114] |
26 of (72) | 8 Del. | 6 Del. | 5 Del. | - | - | - | 7 Del. |
| June 9 | North Dakota Primary[115] 32,786 |
0 of (14) | 4,760 (14.52%) | – | – | – | – | 28,026 (85.48%)[s] | – |
| June 20 | Idaho State Convention[116] |
18 of (18) | 4 Del. | - | 4 Del. | 5 Del. | - | - | 5 Del. |
| June 21 | Iowa State Convention[117] |
17 of (49) | 3 Del. | - | - | 9 Del. | - | - | 5 Del. |
| Total pledged delegates (3,517)[t][118] |
1,997 (56.78%) | 588 (16.72%) | 533 (15.15%) | 38 (1.08%) | 7 (0.20%) | 6 (0.17%) | 271 (7.71%) | ||
Polling
Nationwide
| Poll source | Publication | Jerry Brown
|
Bill Clinton
|
Tom Harkin
|
Bob Kerrey
|
Paul Tsongas
|
Other
|
Undecided
|
|---|---|---|---|---|---|---|---|---|
| Gallup[119] | Sep. 1991 | 21% | 6% | 6% | 5% | 5% | ? | — |
| Gallup[119] | Nov. 1991 | 21% | 9% | 10% | 10% | 7% | ? | — |
| Gallup[119] | Jan. 1992 | 21% | 17% | 9% | 11% | 6% | ? | — |
| New York Times/CBS News[120] | Jan. 1992 | ? | 22% | ? | ? | 10% | ? | — |
| Gallup[119] | Feb. 2, 1992 | 21% | 42% | 9% | 10% | 9% | ? | — |
| New York Times/CBS News[120] | Feb. 22, 1992 | 10% | 29% | 3% | 4% | 24% | 4%[u] | 26% |
- ^ 772 of these delegates were superdelegates, who were uncommitted by default.
- ^ It isn't always clear when a candidate declines to enter the race, as sometimes potential candidates will decline to run but reignite interest later in the cycle, often resulting in another declination. In light of this, the latest declination found by a prospective candidate is used.
- ^ This should not be taken as a finalized list of results. While a significant amount of research was done, most of these results, particularly in regards to delegate allocation, are dependent on reporting from the media. At the present moment there are 77 pledged delegates not accounted for in the table.
- ^ a b Main source combined the results for Harkin and Kerrey; secondary source is used with partial results, with 645 of 665 precincts reporting.
- ^ The last reported results did not include King County, which accounted for about a third of the expected total.
- ^ 2 of 54 Precincts had not yet reported.
- ^ District Delegate count is with only 98.9% results reported, and there may have been others not recorded.
- ^ Only 94% of precincts were reported in by the time of the source.
- ^ Only 96% of precincts were reported in by the time of the source.
- ^ Only results from Washoe County were found.
- ^ The 1st thru 9th Districts held their conventions at this and earlier dates; this is the culminated result of those conventions.
- ^ This is the remainder of the conventions to be held.
- ^ Only 90% of precincts were reported in by the time of the source, so the delegate count may have fluctuated.
- ^ Some of the district conventions were held on a different date, but information on those contests wasn't found amongst sources. The culminated results were reported, and the latest date of the district conventions is used here.
- ^ The delegate allocation is assumed from the caucuses; no definitive result was found amongst later reports of the convention.
- ^ These 3 delegates represent those won by Louis Stokes, who ran as a favorite-son candidate in his congressional district.
- ^ One delegate was awarded to Larry Agran.
- ^ Most of the delegates were selected through District Conventions, but information on these was sparse; as a result, the total result is collected here.
- ^ Ross Perot won the primary with 9,516 write-in votes at (29.02%), Lyndon LaRouche came second with 7,003 votes at (21.36%), Charles Woods came third with 6,641 votes at (20.26%), and Tom Shiekman came fourth with 4,866 votes at (14.84%).
- ^ This does not include the approximately 772 superdelegates, who are uncommitted by default.
- ^ "Someone else" with 4%
State polling
New Hampshire
| Poll source | Publication | Sample size | MoE | Jerry Brown
|
Bill Clinton
|
Mario Cuomo
|
Tom Harkin
|
Bob Kerrey
|
Paul Tsongas
|
Other
|
Undecided
|
|---|---|---|---|---|---|---|---|---|---|---|---|
| USA Today–CNN–Gallup[121] | Feb. 12–14 | 600 V | ±5% | 6% | 23% | – | 14% | 10% | 39% | – | 8% |
| Boston Globe–WBZ-TV[121] | Feb. 13–14 | 400 LV | ±5% | 5% | 25% | 4% | 11% | 11% | 32% | 4% | 8% |
| Mason-Dixon[121] | Feb. 13–15 | 433 V | ±5% | 4% | 21% | 4% | 9% | 8% | 34% | – | 20% |
The convention
The convention met in New York City, and the official tally was:
- Bill Clinton 3,372
- Jerry Brown 596
- Paul Tsongas 209
- Penn. Gov. Robert P. Casey 10
- Rep. Pat Schroeder 8
- Larry Agran 3
- Ron Daniels 1
- Al Gore 1
- Joe Simonetta 1
Clinton chose U.S. Senator Albert A. Gore Jr. (D-Tennessee) to be his running mate on July 9, 1992. Choosing Gore, who is from Clinton's neighboring state of Tennessee, went against the popular strategy of balancing a Southern candidate with a Northern partner. Gore did serve to balance the ticket in other ways, as he was perceived as strong on foreign policy and environmental issues, while Clinton was not.[122] Also, Gore's similarities to Clinton allowed him to push some of his key campaign themes, such as centrism and generational change.[123]
Before Gore's selection, other politicians were mentioned as a possible running-mate, e.g. Bob Kerrey, Dick Gephardt, Mario Cuomo, Indiana Representative Lee H. Hamilton, Pennsylvania Senator Harris Wofford, Florida Senator Bob Graham, and Massachusetts Senator John Kerry.
The Democratic Convention in New York City was essentially a solidification of the party around Clinton and Gore, though there was controversy over whether Jerry Brown, who did not endorse Clinton, would be allowed to speak. Brown did speak at the convention by seconding his own nomination.
Another additional controversy concerned Pennsylvania Governor Bob Casey, who sought a speaking slot at the convention but was not granted one. Casey complained that it was because of his outspoken anti-abortion views: he had warned the platform committee that Democrats were committing political suicide because of their support for abortion rights.[124] Clinton supporters have said that Casey was not allowed to speak because he had not endorsed the ticket.[125]
Popular vote results
Total popular vote number in primaries:[126]
- Bill Clinton - 10,482,411 (52.01%)
- Jerry Brown - 4,071,232 (20.20%)
- Paul Tsongas - 3,656,010 (18.14%)
- Unpledged - 750,873 (3.73%)
- Bob Kerrey - 318,457 (1.58%)
- Tom Harkin - 280,304 (1.39%)
- Lyndon LaRouche - 154,599 (0.77%)
- Eugene McCarthy - 108,678 (0.54%)
- Charles Woods - 88,948 (0.44%)
- Larry Agran - 58,611 (0.29%)
- Ross Perot - 54,755 (0.27%)
- Ralph Nader - 35,935 (0.18%)
- Louis Stokes - 29,983 (0.15%)
- Angus Wheeler McDonald - 9,900 (0.05%)
- J. Louis McAlpine - 7,911 (0.04%)
- George W. Benns - 7,887 (0.04%)
- Rufus T. Higginbotham - 7,705 (0.04%)
- Tod Howard Hawks - 7,434 (0.04%)
- Stephen Bruke - 5,261 (0.03%)
- Tom Laughlin - 5,202 (0.03%)
- Tom Shiekman - 4,965 (0.03%)
- Jeffrey F. Marsh - 2,445 (0.01%)
- George Ballard - 2,067 (0.01%)
- Ray Rollinson - 1,206 (0.01%)
- Lenora Fulani - 402 (0.00%)
- Douglas Wilder - 240 (0.00%)
Maps
-
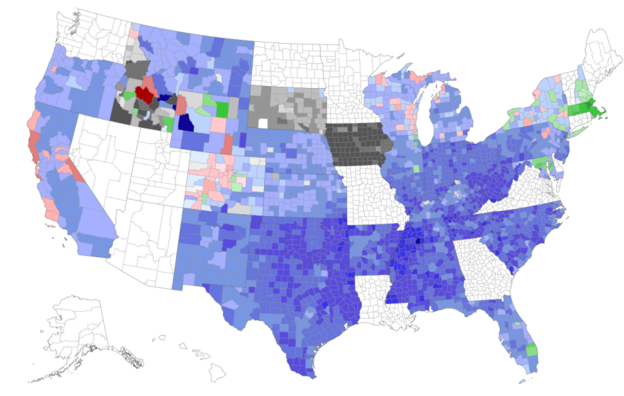 Results by county

Convention tallies
For President:[127]
- Bill Clinton - 3,372 (80.27%)
- Jerry Brown - 596 (14.19%)
- Paul Tsongas - 209 (4.98%)
- Robert P. Casey - 10 (0.24%)
- Patricia Schroeder - 8 (0.19%)
- Larry Agran - 3 (0.07%)
- Ron Daniels - 1 (0.02%)
- Al Gore - 1 (0.02%)
- Joe Simonetta 1 (0.02%)
Vice presidential nomination
Clinton selected Tennessee Senator and 1988 candidate Al Gore to be his running-mate. Among others confirmed possible V.P. nominees, who were finalists of Clinton's selection were:
- Jay Rockefeller, U.S. senator from West Virginia
- Bob Graham, U.S. senator from Florida
- Lee H. Hamilton, U.S. representative from Indiana.[128]
- Tom Harkin, U.S. senator from Iowa
- Bob Kerrey, U.S. senator from Nebraska
- George Mitchell, U.S. Senate Majority Leader from Maine
- Paul Tsongas, former U.S. senator from Massachusetts
- Doug Wilder, Governor of Virginia
- Harris Wofford, U.S. senator from Pennsylvania
Clinton's list of finalists did not include Senator Bill Bradley of New Jersey and Governor of New York Mario Cuomo, who publicly disavowed interest in the vice presidency.[128]
Convention tally for vice president
- Al Gore - was nominated by acclamation on a voice vote.
In popular media
The story of the race was covered in the 1993 documentary film The War Room and fictionalized into the 1996 novel and 1998 film Primary Colors.
See also
Bibliography
- My Life by Bill Clinton, 2004, Vintage. ISBN 1-4000-3003-X
References
- ^ "Larry J. Sabato's Crystal Ball » The Modern History of the Democratic Presidential Primary, 1972–2008". www.centerforpolitics.org. Retrieved 23 March 2018.
- ^ Abramson, Aldrich & Rohde 1995, p. 22.
- ^ Kagay, Michael R. (May 22, 1991). "History Suggests Bush's Popularity will eventually ebb". The New York Times. Retrieved May 1, 2010.
- ^ Dickerson, John (2016). Whistlestop: My Favorite Stories from Presidential Campaign History. Grand Central Publishing. p. 68. ISBN 9781455540464.
- ^ Popkin, Samuel L. (2012). The Candidate: What it Takes to Win - and Hold - the White House. Oxford University Press. p. 20. ISBN 9780199939411.
the guy who loses to bush.
- ^ Saturday Night Live (November 2, 1991). Campaign '92: The Race to Avoid Being the Guy who Loses to Bush (NBC.com). Retrieved June 9, 2019.
- ^ "Al Gore's son busted for drugs in hybrid car". Reuters. July 5, 2007.
- ^ "Bumper's Statement Reviewed". The Sun. April 22, 1990. p. D1 – via Newspapers.com.
- ^ "Dukakis Ready For Academic Life". Pensacola News Journal. November 26, 1990. p. 2 – via Newspapers.com.
- ^ "Silber Denies Plans For Presidential Bid". Daily Hampshire Gazette. March 9, 1991. p. 23 – via Newspapers.com.
- ^ "Ga. Senator Won't Rule Out Democrats Yet". The Macon Telegraph. March 11, 1991. p. 1B – via Newspapers.com.
- ^ "Schroeder Dismisses '92 Presidential Bid". The Daily Sentinel. March 14, 1991. p. B1 – via Newspapers.com.
- ^ "Hard-To-Beat Bush Candidacy Has Top Dems Looking To 1996". Tarrytown Daily News. April 18, 1991. p. 14 – via Newspapers.com.
- ^ "McGovern Says No To Bid". Argus-Leader. May 24, 1991. p. 1 – via Newspapers.com.
- ^ "Solarz A Forceful Voice On Foreign Policy". The Los Angeles Times. July 5, 1991. p. A30 – via Newspapers.com.
- ^ "Solarz: A Forceful Voice". The Los Angeles Times. July 5, 1991. p. A31 – via Newspapers.com.
- ^ "Gephardt: I Will Not Run For President In '92". Press and Sun-Bulletin. July 18, 1991. p. 3 – via Newspapers.com.
- ^ "Rockefeller Won't Seek Presidency". The Morning Call. August 8, 1991. p. A8 – via Newspapers.com.
- ^ "Gore Won't Seek Presidency In 1992 Race". Bristol Herald Courier. August 22, 1991. p. 3B – via Newspapers.com.
- ^ "Bentsen Nixes Presidential Bid". San Angelo Standard-Times. August 29, 1991. p. 11A – via Newspapers.com.
- ^ "Bradley: 'We'll See' About Run For President". Press of Atlantic City. August 29, 1991. p. C2 – via Newspapers.com.
- ^ "Ducking '92 Race". Newsday (Suffolk Edition). October 19, 1991. p. 9 – via Newspapers.com.
- ^ "Jackson Forgoes '92 Presidential Bid". The Daily Times. November 3, 1991. p. A3 – via Newspapers.com.
- ^ "Mario: I'll Take New York". Star-Gazette. December 21, 1991. p. 1 – via Newspapers.com.
- ^ a b c d e "Democrats Wary Of A 1992 Crapshoot". Press and Sun-Bulletin. March 29, 1991. p. 9A – via Newspapers.com.
- ^ a b "Richards For President?". The Orange Leader. September 24, 1991. p. 3B – via Newspapers.com.
- ^ "Experts Like Schwarzkopf's Future Political Chances". The Naples Daily News. March 18, 1991. p. 2B – via Newspapers.com.
- ^ Abramson, Aldrich & Rohde 1995, pp. 15–16.
- ^ "Declaration of Gennifer Flowers". The Washington Post. March 13, 1998. Retrieved March 20, 2008.
- ^ a b Walker, Jesse (2009-11-01) Five Faces of Jerry Brown Archived 2011-06-29 at the Wayback Machine, The American Conservative
- ^ Abramson, Aldrich & Rohde 1995, p. 33.
- ^ Abramson, Aldrich & Rohde 1995, p. 38.
- ^ "Maine Caucus Results Show Brown Winner". The Bangor Daily News. March 20, 1992. p. 8 – via Newspapers.com.
- ^ "Maine Caucuses". Journal Tribune. February 24, 1992. p. 3 – via Newspapers.com.
- ^ Berkes, Richard (26 Feb 1992). "Kerrey Is South Dakota Victor". The New York Times. p. A1.
- ^ a b Edsall, Thomas (4 Mar 1992). "Brown Prevails In Colorado Test". The Washington Post. p. A1.
- ^ "March 3 Primary & Caucus Results". Omaha World-Herald. March 4, 1992. p. 8 – via Newspapers.com.
- ^ "Harkin Wins Idaho State Caucus". Bonner County Daily Bee. March 4, 1992. p. 12 – via Newspapers.com.
- ^ "March 3 Primary & Caucus Results". Omaha World-Herald. March 4, 1992. p. 8 – via Newspapers.com.
- ^ "March 3 Primary & Caucus Results". Omaha World-Herald. March 4, 1992. p. 8 – via Newspapers.com.
- ^ "March 3 Primary & Caucus Results". Omaha World-Herald. March 4, 1992. p. 8 – via Newspapers.com.
- ^ "'Dropout' Wins Demo Caucuses". Peninsula Daily News. March 20, 1992. p. 5 – via Newspapers.com.
- ^ "Bush Happy With Results Of Three State Primaries". The Union. March 4, 1992. p. 7 – via Newspapers.com.
- ^ "Vote Results". The Los Angeles Times. March 8, 1992. p. A20 – via Newspapers.com.
- ^ "Vote Results". The Los Angeles Times. March 8, 1992. p. A20 – via Newspapers.com.
- ^ "Vote Results". The Los Angeles Times. March 8, 1992. p. A20 – via Newspapers.com.
- ^ "Clinton Top Votegetter At Democratic Caucucses". Casper Star-Tribune. March 8, 1992. p. 1 – via Newspapers.com.
- ^ "Nevada's County-By-County Numbers". Reno Gazette-Journal. March 9, 1992. p. 3A – via Newspapers.com.
- ^ "Delaware Backs Tsongas - Just Barely". The News Journal. March 11, 1992. p. 1 – via Newspapers.com.
- ^ "Caucus: Confusing System Wins Foes". The News Journal. March 12, 1992. p. 4 – via Newspapers.com.
- ^ "Florida Primary". The Orlando Sentinel. March 11, 1992. p. 1 – via Newspapers.com.
- ^ "Clinton Wins 16 Hawaii Delegates". Honolulu Star-Advertiser. March 17, 1992. p. A3 – via Newspapers.com.
- ^ "Super Tuesday At A Glance". The Times. March 11, 1992. p. 1B – via Newspapers.com.
- ^ "State-By-State Results". The San Francisco Examiner. March 11, 1992. p. A18 – via Newspapers.com.
- ^ "State-By-State Results". The San Francisco Examiner. March 11, 1992. p. A18 – via Newspapers.com.
- ^ "Flawed Caucus System Appears To Be Here To Stay". The Kansas City Star. March 12, 1992. p. 1 – via Newspapers.com.
- ^ "State-By-State Results". The San Francisco Examiner. March 11, 1992. p. A18 – via Newspapers.com.
- ^ "State-By-State Results". The San Francisco Examiner. March 11, 1992. p. A18 – via Newspapers.com.
- ^ "State-By-State Results". The San Francisco Examiner. March 11, 1992. p. A18 – via Newspapers.com.
- ^ "State-By-State Results". The San Francisco Examiner. March 11, 1992. p. A18 – via Newspapers.com.
- ^ "June Primaries May Lock Up Clinton Win". The San Bernardino County Sun. March 19, 1992. p. A18 – via Newspapers.com.
- ^ "June Primaries May Lock Up Clinton Win". The San Bernardino County Sun. March 19, 1992. p. A18 – via Newspapers.com.
- ^ Ceaser, James W.; Busch, Andrew (1993). Upside Down and Inside Out: The 1992 Elections and American Politics. p. 61.
- ^ "Clinton Leads N.D. Count Of Delegates". The Forum. March 21, 1992. p. A5 – via Newspapers.com.
- ^ "Connecticut: Brown Gets Surprising Win Over Clinton". The Los Angeles Times. March 25, 1992. p. A12 – via Newspapers.com.
- ^ "Tally Of Democrat Delegates". The Des Moines Register. March 30, 1992. p. 5A – via Newspapers.com.
- ^ "Clinton Says Brown's Flat Tax Would Hurt The Poor". The San Francisco Examiner. March 29, 1992. p. A8 – via Newspapers.com.
- ^ "Delegate Breakdown". The Burlington Free Press. April 1, 1992. p. 1 – via Newspapers.com.
- ^ "Alaska's Democrats Mostly Uncommitted". Daily Press. Apr 4, 1992. p. A3 – via Newspapers.com.
- ^ "Some Big Names Not On N.D. Primary Ballot". Grand Forks Herald. April 11, 1992. p. 9A – via Newspapers.com.
- ^ "Clinton Sweeps Puerto Rico Vote". South Florida Sun Sentinel. April 6, 1992. p. 3A – via Newspapers.com.
- ^ "Clinton, Bush Are Big Winners". The Salina Journal. April 8, 1992. p. 1 – via Newspapers.com.
- ^ "Minnesota Primary". Star Tribune. April 8, 1992. p. 12A – via Newspapers.com.
- ^ "Primaries: Clinton Wins New York". The Los Angeles Times. April 8, 1992. p. A10 – via Newspapers.com.
- ^ "Wisconsin Goes With Clinton". The La Crosse Tribune. April 9, 1992. p. A2 – via Newspapers.com.
- ^ "Wisconsin Democrats Apportion Delegates". The Daily Tribune. April 22, 1992. p. 5B – via Newspapers.com.
- ^ "Brown Tops Washoe Tally". Reno Gazette-Journal. April 12, 1992. p. 1 – via Newspapers.com.
- ^ "Caucus Results: Clinton Gets 41 Delegates Statewide". The News and Advance. April 16, 1992. p. B1 – via Newspapers.com.
- ^ "Clinton Picks Up Four More Delegates". St. Joseph News-Press. April 16, 1992. p. 4B – via Newspapers.com.
- ^ "Delaware Democrats Meet To Put Together Delegation". The News Journal. April 26, 1992. p. A10 – via Newspapers.com.
- ^ "Clay Jr. Going To Convention As Delegate Pledged To Clinton". St. Joseph News-Press. April 26, 1992. p. 6A – via Newspapers.com.
- ^ "Uncommitted Demos In Lead". Peninsula Daily News. April 27, 1992. p. A5 – via Newspapers.com.
- ^ "Non-Urban Caucuses Give Clinton A Delegate Boost". The News Tribune. May 7, 1992. p. B8 – via Newspapers.com.
- ^ "Primary: Clinton And Bush Win Big In Pennsylvania Races". The Los Angeles Times. April 29, 1992. p. A14 – via Newspapers.com.
- ^ "Democrats Choose Delegates". The Des Moines Register. May 2, 1992. p. 3B – via Newspapers.com.
- ^ "Missouri Caucuses End; Clinton Gains 44 Delegates". St. Louis Post-Dispatch. May 3, 1992. p. D1 – via Newspapers.com.
- ^ "Democrats Blast Bush At Convention". Reno Gazette-Journal. May 3, 1992. p. B1 – via Newspapers.com.
- ^ "Wyoming Democrats Conclude Convention With Short Platform". Casper Star-Tribune. May 4, 1992. p. B1 – via Newspapers.com.
- ^ "Clinton Picks Up Guam Delegates". Thousand Oaks Star. March 4, 1992. p. A6 – via Newspapers.com.
- ^ "Results Of Major Races". USA Today. May 7, 1992. p. 4A – via Newspapers.com.
- ^ "Results Of Major Races". USA Today. May 7, 1992. p. 4A – via Newspapers.com.
- ^ "Results Of Major Races". USA Today. May 7, 1992. p. 4A – via Newspapers.com.
- ^ "Clinton Must Work To Take Minnesota". The Winona Daily News. May 2, 1992. p. 6A – via Newspapers.com.
- ^ "Bush, Clinton Record Wins". Fremont Tribune. May 13, 1992. p. A5 – via Newspapers.com.
- ^ "Bush, Clinton Record Wins". Fremont Tribune. May 13, 1992. p. A5 – via Newspapers.com.
- ^ "Vt. Democrats Split With Dean". The Burlington Free Press. May 17, 1992. p. 1 – via Newspapers.com.
- ^ "Clinton Picks Up Six Delegates At State Convention". The Bangor Daily News. May 18, 1992. p. 1 – via Newspapers.com.
- ^ "Northwest Voters Give Perot The Write-In". The Tribune. May 20, 1992. p. A2 – via Newspapers.com.
- ^ "Northwest Voters Give Perot The Write-In". The Tribune. May 20, 1992. p. A2 – via Newspapers.com.
- ^ "Primaries". The Union. May 27, 1992. p. 12 – via Newspapers.com.
- ^ "Primaries". The Union. May 27, 1992. p. 12 – via Newspapers.com.
- ^ "Primaries". The Union. May 27, 1992. p. 12 – via Newspapers.com.
- ^ "Democrats". The News Tribune. May 31, 1992. p. B1 – via Newspapers.com.
- ^ "Democrats Name Convention Delegates". The Peninsula Clarion. June 1, 1992. p. 6 – via Newspapers.com.
- ^ "1,000 Dems To Huddle This Weekend". Honolulu Star-Advertiser. May 30, 1992. p. A2 – via Newspapers.com.
- ^ "Presidential Primaries". Dayton Daily News. June 4, 1992. p. 7D – via Newspapers.com.
- ^ "Presidential Primary California". The Desert Sun. June 4, 1992. p. A7 – via Newspapers.com.
- ^ "Presidential Primaries". Dayton Daily News. June 4, 1992. p. 7D – via Newspapers.com.
- ^ "Results Of Tuesday's Primaries". The Los Angeles Times. May 27, 1992. p. A20 – via Newspapers.com.
- ^ "Presidential Primaries". Dayton Daily News. June 4, 1992. p. 7D – via Newspapers.com.
- ^ "Presidential Primaries". Dayton Daily News. June 4, 1992. p. 7D – via Newspapers.com.
- ^ "DFLers Withhold Clinton Support". The Winona Daily News. June 7, 1992. p. 6A – via Newspapers.com.
- ^ "Robb Reaches Out To Wilder". The Daily News Leader. June 7, 1992. p. 1 – via Newspapers.com.
- ^ "Some State Demo Delegates For Clinton, But..." The Bellingham Herald. June 9, 1992. p. B3 – via Newspapers.com.
- ^ "Presidential Primaries". Dayton Daily News. June 4, 1992. p. 7D – via Newspapers.com.
- ^ "Harkin Beats Clinton For Gem Delegates". The Times-News. June 21, 1992. p. B3 – via Newspapers.com.
- ^ "Davenport Woman Is Delegate". Quad-City Times. June 22, 1992. p. 3B – via Newspapers.com.
- ^ "Hurry-up Primaries Produce Surprise Package For Voters". The Press-Tribune. March 16, 1992. p. A4 – via Newspapers.com.
- ^ a b c d "US President - D Primaries Polling". OurCampaigns.com. 11 Dec 2010. Retrieved 29 Oct 2020.
- ^ a b Apple, R.W. (22 Feb 1992). "Tsongas Gains Substantially, Pulling Near Clinton in Poll". The New York Times. p. 1.
- ^ a b c "Latest poll shows Tsongas holding lead over Clinton". The Hartford Courant. 16 Feb 1992. p. A25.
- ^ Ifill, Gwen (1992-07-10). "Clinton Selects Senator Gore Of Tennessee As Running Mate". The New York Times. Retrieved 2008-03-27.
- ^ "U.S. Senate: Albert A. Gore, Jr., 45th Vice President (1993-2001)". www.senate.gov. Retrieved 23 March 2018.
- ^ The Atlanta Journal and The Atlanta Constitution May 19, 1992 Page: A/8
- ^ "The myth of Bob Casey's 1992 non-speech". Brendan Nyhan. 2008-08-07. Retrieved 2016-08-03.
- ^ "US President - D Primaries Race - Feb 01, 1992". Our Campaigns. Retrieved 2016-08-03.
- ^ "US President - D Convention Race - Jul 13, 1992". Our Campaigns. Retrieved 2016-08-03.
- ^ a b Ifill, Gwen (July 10, 1992). "THE 1992 CAMPAIGN: Democrats; CLINTON SELECTS SENATOR GORE OF TENNESSEE AS RUNNING MATE". The New York Times. Retrieved May 1, 2010.
Works cited
- Abramson, Paul; Aldrich, John; Rohde, David (1995). Change and Continuity in the 1992 Elections. CQ Press. ISBN 0871878399.